The Pennsylvania Public Utility Commission (PUC) has a database of all the alternative energy generators certified in Pennsylvania. Using this data where the fuel type is SUN we can see the solar installations over time. SUN is a great fuel type!
This article focuses on the five county area in southeast Pennsylvania.
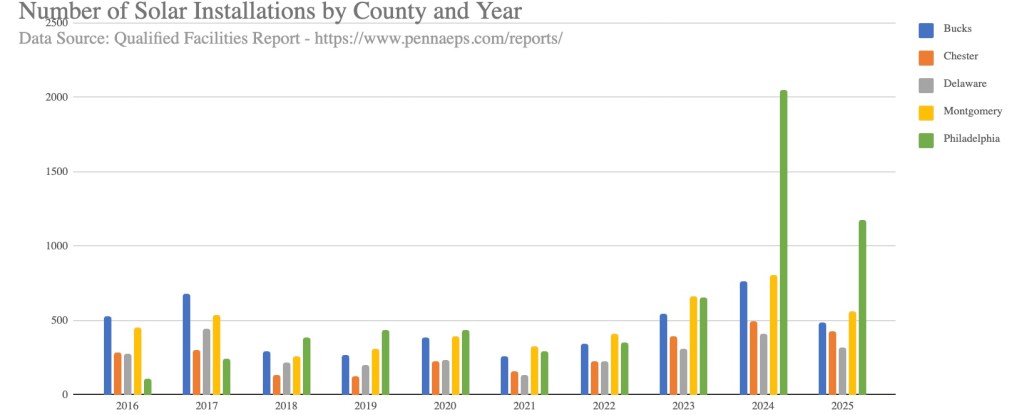
This first chart is the number of installations each year from 2016 through 2025 by county.
Philadelphia’s Solarize Philly started in 2018 which may explain the rise in installations in Philadelphia. That program continued to grow focusing on row houses which likely resulted in the large increases in 2024 and 2025.
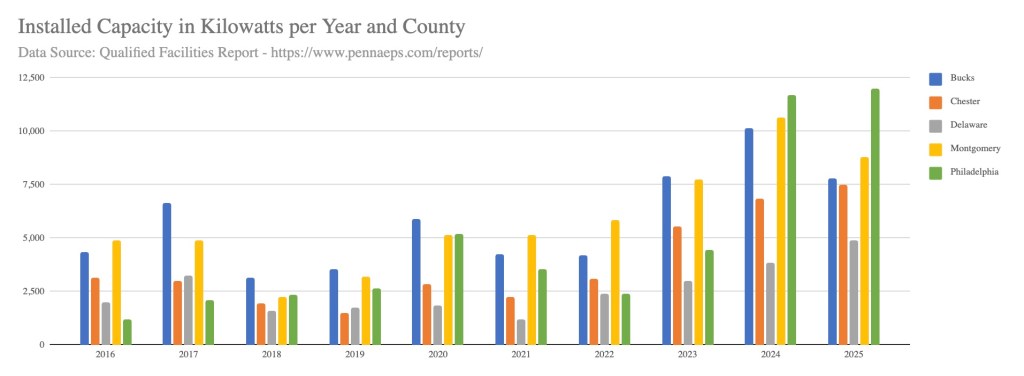
This next chart shows the amount of solar installed by size (kilowatts). Bigger systems in some areas make the chart look different from the number of installations. Philadelphia tends to have smaller systems, which explains the relatively shorter bar for size vs counts.
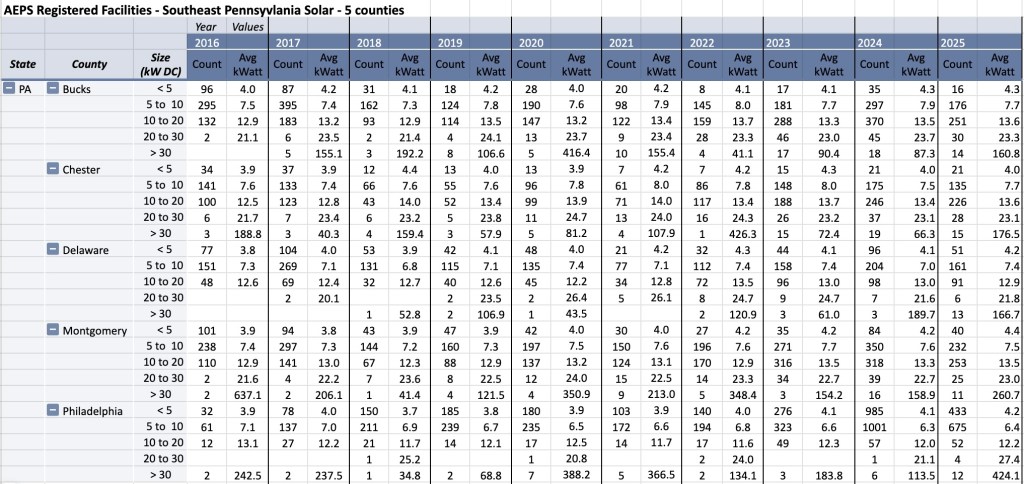
Looking at the actual data for the past 10 years, the table below shows the counts by system size. Philadelphia has a lot of small systems – you can see that there were close to 1000 systems less than 5 kiloWatts in 2024.
There are also some big projects. There were two projects over 1 MegaWatt in 2025 in Philadelphia.