
The Pennsylvania Public Utility Commission (PUC) has a database of all the alternative energy generators certified in Pennsylvania. Using this data where the fuel type is SUN we can see the solar installations over time. SUN is a great fuel type!
This article focuses on the five county area in southeast Pennsylvania. I will update these charts periodically.
This first chart is the number of installations each year since 2006 by county. The first surge in 2010 coincides with the PA Sunshine Solar Rebate. Philadelphia’s Solarize Philly kicked into high great 2018 which may explain the rise in installations in Philadelphia. I’m not sure what explains the overall increases in 2016 or the large numbers in Bucks County and Montgomery County in 2016 and 2017. General awareness of the reality of climate change and the decrease in the cost of solar were no doubt factors. This chart includes data through the end of 2023. The increase may be helped by the return of the 30% tax credit.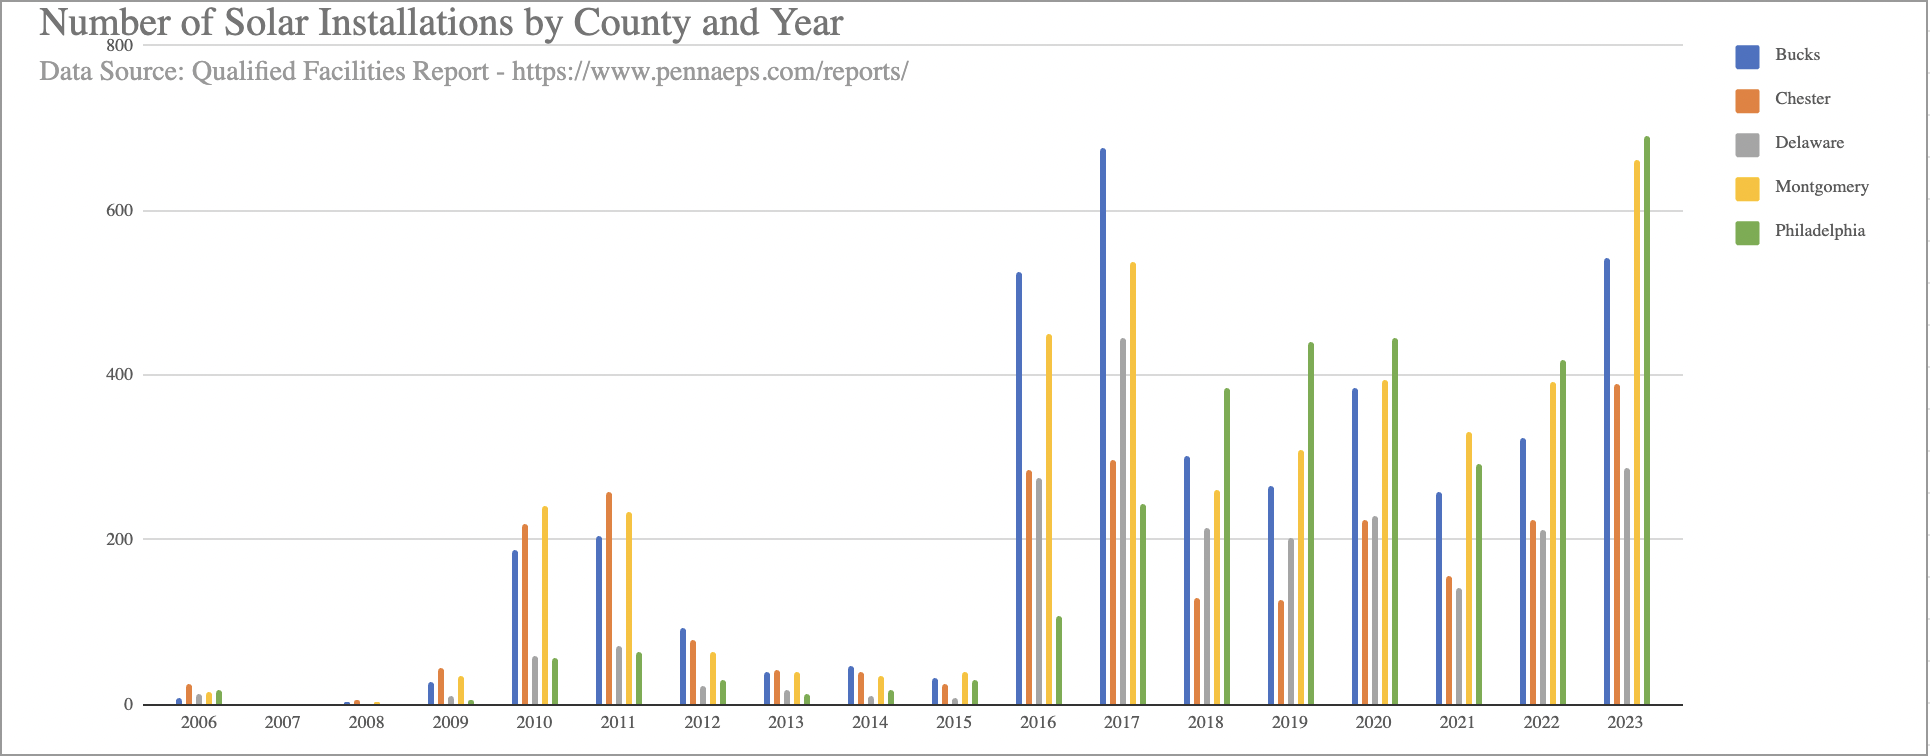
This next chart shows the amount of solar installed by kilowatt. Bigger systems in some areas make the chart look different from the number of installations. Philadelphia tends to have smaller systems, which explains the relatively shorter bar for size vs counts.
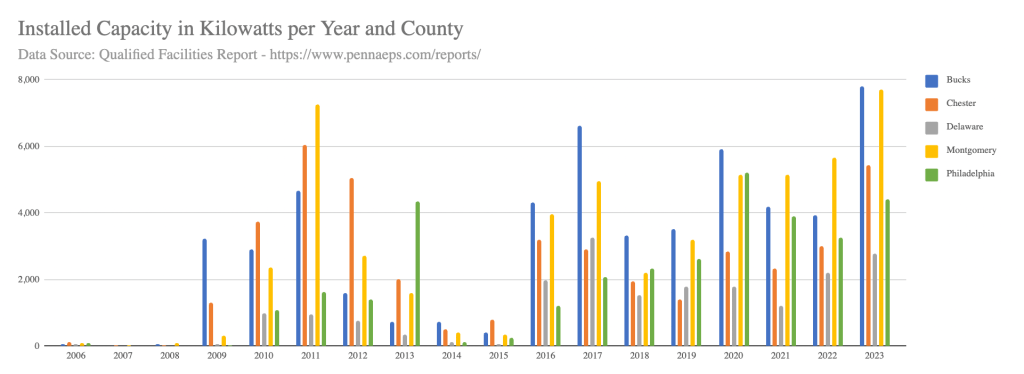
Looking at the actual data for the past 10 years, the table below shows the counts by system size. There are some big projects. The biggest one in Philadelphia was in 2013 at the Eagles Stadium which is a 3,200 kWatt system. This explains the high green bar in 2013 for capacity, but the tiny bar for the number of systems for that same year.
Note: There were two other systems that year over 30 kW that brought down the average.

These tables and charts use the data from the PA PUC’s Pennsylvania’s Alternative Energy Credit Program. Here is the link if you want to download the data yourself. Under Qualified Facilities you’ll see an option to download the csv file.
